DAY 1: A Heated Debate
Activity 1: Togs or Trackies? 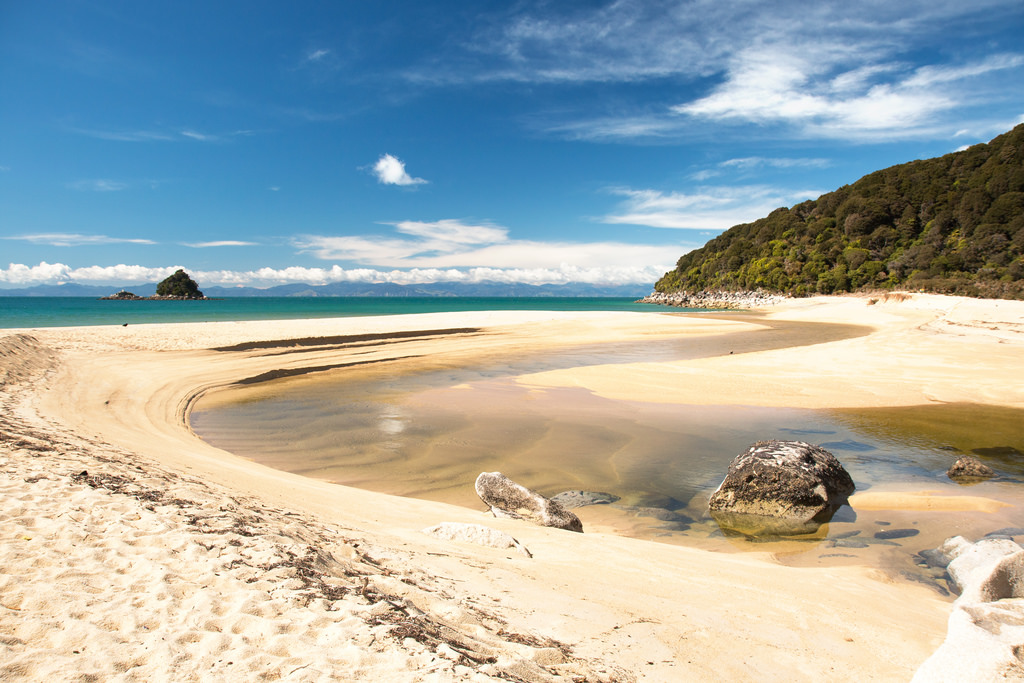
New Zealand is a pretty lovely place to live, isn’t it? Apparently, New Zealand (NZ) is also a pretty lovely place to visit. In 2017 approximately 2-3 million people came to visit NZ as tourists. Some of them chose to come in the middle of our summer, while others braved it and came in the middle of winter! When do you think is the best time of year (season) to visit NZ?
If you would like some help making a decision, feel free to read the Go New Zealand website. It has lots of information about the seasons in NZ!
I, personally, encourage my friends and family from overseas to come and visit NZ in early spring. The weather is usually warm and dry and the tourist attractions, beaches and holiday spots are less busy than they are in the middle of summer.
1. tourists can come and swim with us
2. they can play with the fishes in NZ
3. They can have some fun swimming with them selve in the sea.
I think summer is a good time for a tourtist in new zealand.
Activity 2: You are my Sunshine

People in New Zealand love spending time outdoors. Unfortunately, the sun is very powerful and the rates of skin cancer are incredibly high in New Zealand. In fact, they are higher than anywhere else in the entire world! To protect ourselves against skin cancer, we need to be careful about how much time we spend in the sun. We have to be ‘Sunsmart.’
1. WE CAN WEAR SUN SCREEN
2. WE CAN USE AN UNBRELLA
3. WE CAN STAY INSIDE
4. WE CAN STAY IN THE SHADE
5. WE CAN STAY IN THE CARPORT
Activity 3: Burning Up… [15 points]
While it can get hot in New Zealand, especially in the middle of summer, it gets even hotter in places like Dallol (Ethiopia), Dasht-e Loot (Iran), Tirat Zvi (Israel), Kabili (Tunisia) and Bandar-e Mahshahr (Iran).
The hottest temperature on record in each place is: Dallol: 41oC; Dasht-e Loot: 71oC; Tirat Zvi: 54oC; Kabili: 55oC; Bandar-e Mahshahr: 51oC. Crazy ‘eh?!
For this activity, you are asked to use this information to create a graph. The graph should have a title along with the names of each city and their hottest recorded temperatures. You can draw the graph by hand or use a computer programme like Google Draw to create your graph. It’s completely up to you!
Here is an example of a graph:

Hey there Precious, it's Billy here from the Summer Learning Journey programme. I was commenting on blogs last summer - I wonder if you remember me?
ReplyDeleteIt's fantastic to see that you are working hard and completing lots of activities again.
Thank you for writing and posting five different tips for people to stay safe in the sun this summer.
I really like the idea of taking a break and going inside. The sun is the hottest between about 11am and 2pm so this is a good time to go inside, have lunch, drink some water and take a break. The sun dehydrates you so if you are outside you should drink lots of water.
I am living over in London at the moment and it's really strange in summer because the sun is the hottest at around 5pm. Why do you think that is?
What sort of outdoor activities have you been doing this summer?
Thanks, Billy.
Talofa Precious,
ReplyDeleteCia here from the Summer Learning Journey Ako Hiko team. I have the opportunity today to engage with some of you people here in the Manaiakalani Cluster which is awesome.
I think you picked a fun season for tourists to come over for a visit, summer is a really busy time but trips to the beach, river or pools make it worth it.
A friendly reminder; remember that the task has asked you to include three things tourists could do while they are here. Please edit your post to include one more thing tourists could do as you have included swimming twice. Think about the great places they could visit here in Aotearoa. Do you know a beach in Auckland they could enjoy?
I can see that you have thought about how you could show the data about the hottest temperatures found in places around the world. Unfortunately the line graph you have included is hard to see and does not show the information accurately at all.
Please edit your post to include a graph that shows the information properly. Make sure you are detailed with the labelling on your graph, for example, let people know what the numbers mean. In this case it would be 'Temperature (°C)', remember to title your graph. You got this!
Keep persevering and working hard.
Toe feiloa'i fo'i (see you again),
Cia.